5 min read
Overview
In this guide, we'll walk you through how to leverage the QuickNode Console API's Prometheus support to build a Grafana dashboard for advanced metrics visualization.
What You Will Do
- Set up a Prometheus exporter and build a Grafana dashboard to monitor your RPC infrastructure
What You Will Need
- A QuickNode account with an Enterprise plan
- Docker Desktop installed and running on your computer
- Basic knowledge of Prometheus and Grafana (We will guide you through each step)
Prometheus exporter is only available for our Enterprise customers. If you are interested, please contact us.
Introduction to the QuickNode Console API
The QuickNode Console API offers powerful programmatic access to all actions available within the User Dashboard, enabling you to manage your infrastructure, monitor performance, and control your costs more effectively. In this guide, we’ll focus specifically on using the Prometheus exporter to build a comprehensive monitoring dashboard with Grafana.
If you're interested in learning how to use the Console API for endpoint management, check out our guide: How to Manage Your RPC Infrastructure with QuickNode Console API.
Prerequisites
QuickNode Account and API Key
Creating your API key is straightforward.
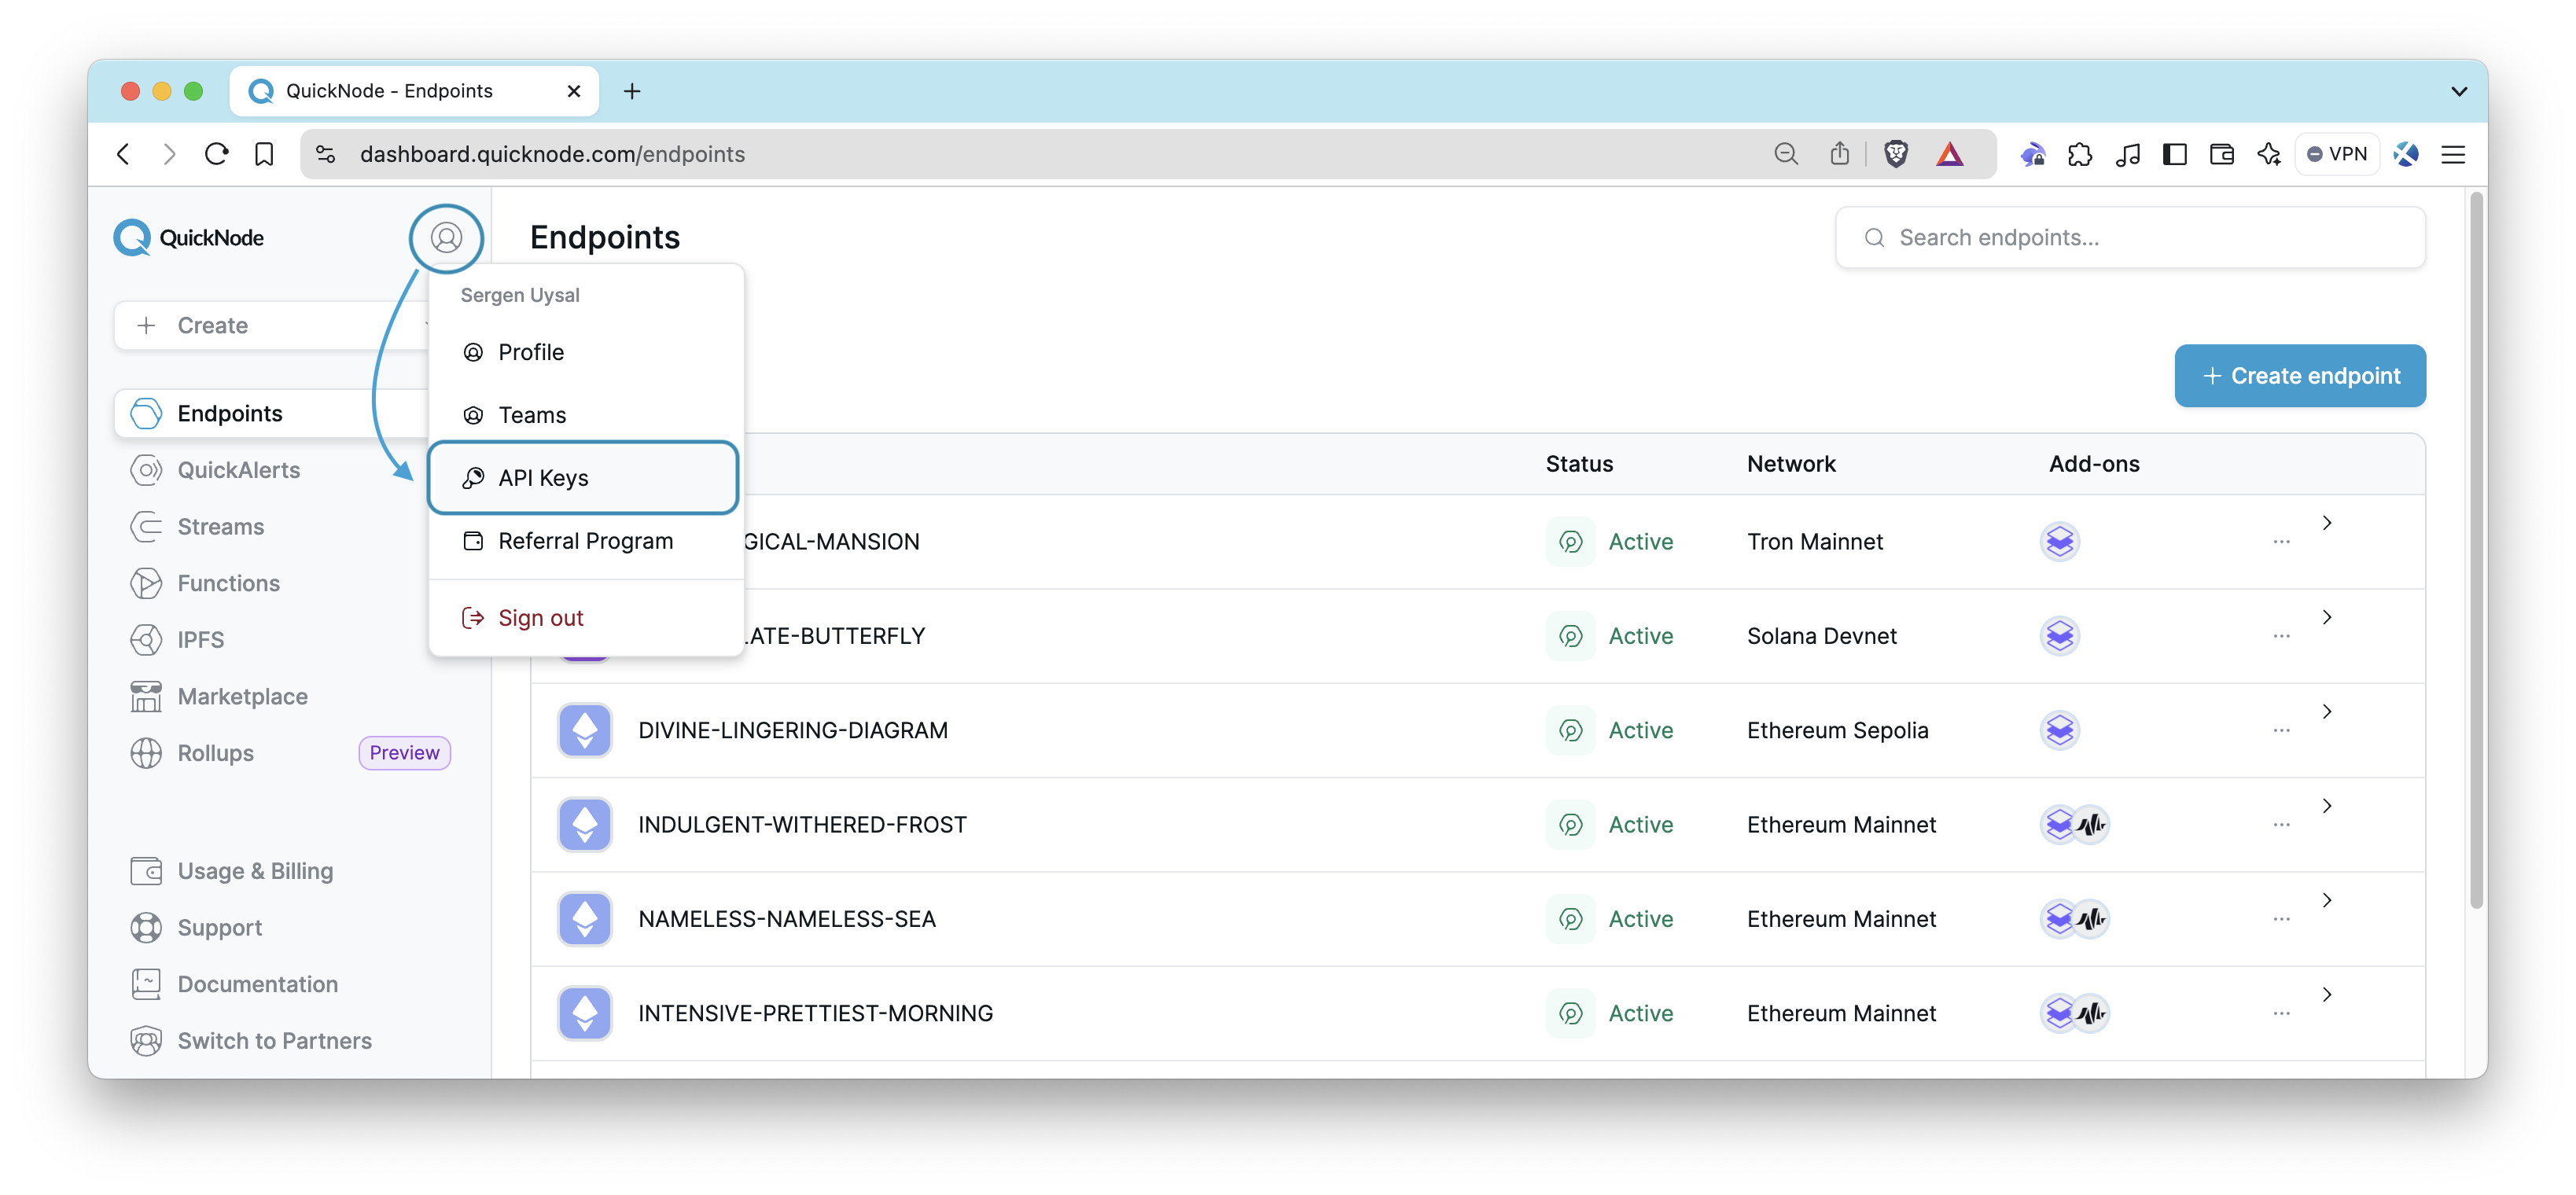
- Log in to your QuickNode Account.
- Click on the avatar icon on the top left, and select API Keys to access the API Keys page.
- Generate an API key with appropriate permissions (you'll need
CONSOLE_RESTto use the Console API) and keep it handy as you'll use it shortly.
Docker Desktop
Ensure you have Docker Desktop installed and running. We will use Docker to launch Prometheus and Grafana quickly.
Building a Grafana Dashboard with Prometheus Exporter
In this section, we'll guide you through setting up Prometheus and Grafana using Docker to monitor your QuickNode metrics. Since we will be using Docker, you do not need to install Prometheus and Grafana separately.
Prometheus: An open-source monitoring system that collects and stores metrics as time series data, enabling you to track and analyze various performance metrics over time.
Grafana: A powerful open-source analytics and visualization tool that lets you create dynamic, interactive dashboards for visualizing metrics from data sources like Prometheus.
Docker: A platform for developing, shipping, and running applications in containers. In this setup, we'll use Docker to run Prometheus and Grafana in isolated containers, simplifying the installation and configuration process.
We have created a folder in QuickNode's qn-guide-examples repository, which contains all the necessary configuration files for Prometheus and Grafana.
.
├── docker-compose.yaml                     # Docker Compose file to launch Prometheus and Grafana
├── grafana
│   ├── dashboards
│   │   │   └── QuickNode Console API.json  # Grafana dashboard JSON file
│   ├── provisioning
│   │   ├── dashboards
│   │   │   └── main.yaml                   # Configuration for loading dashboards into Grafana
│   │   └── datasources
│   │       └── prometheus-source.yaml      # Configuration for connecting Grafana to Prometheus
├── prometheus
│   └── prometheus.yaml                     # Prometheus configuration file
Follow these steps to get started:
Step 1: Clone the Sample Project Repository
Open your terminal/command prompt and clone the repository:
You can now access Logs for your RPC endpoints, helping you troubleshoot issues more effectively. If you encounter an issue with your RPC calls, simply check the logs in your QuickNode dashboard to identify and resolve problems quickly. Learn more about log history limits on our pricing page.
git clone https://github.com/quiknode-labs/qn-guide-examples.git
Navigate to the grafana-dashboard folder within the cloned repository:
cd qn-guide-examples/console-api/grafana-dashboard
Step 2: Update Your API Key
Open the prometheus.yaml file located in the prometheus directory.
Replace <YOUR_API_KEY> with your actual QuickNode API key that you generated earlier:
global:
  scrape_interval: 30s

scrape_configs:
  - job_name: "quicknode_prometheus_exporter"
    metrics_path: "v0/prometheus/metrics"
    scheme: "http"
    authorization:
      type: "bearer"
      credentials: "<API_KEY>"
    # fallback_scrape_protocol: PrometheusText0.0.4
    static_configs:
      - targets: ["api.quicknode.com"]
Note: If you are using Prometheus 3.x, you may need to add the fallback_scrape_protocol field to the scrape_configs section.
To do this, you can simply uncomment the highlighted line in the above example.
Step 3: Launch Prometheus and Grafana with Docker
We have pre-configured a docker-compose.yaml file to simplify the setup. You can launch both Prometheus and Grafana by running the command below from the root directory (i.e., grafana-dashboard):
docker-compose up
Add -d flag to start the services in detached mode, running them in background.
Step 4: Access Grafana and View Your Dashboard
- Open a web browser and go to http://localhost:3000.
- Log in with the project credentials (username:
admin, password:password) (as determined in thedocker-compose.yamlfile) - Navigate to
Dashboards. - Find and click on the QuickNode Console API dashboard.
You should now see the dashboard displaying metrics from your QuickNode endpoint.
Note: If the dashboard appears empty, it means there hasn't been any activity on your endpoint yet. Make sure to perform some activity (e.g., sending RPC requests to your endpoint) to start generating data that will be reflected on the dashboard.
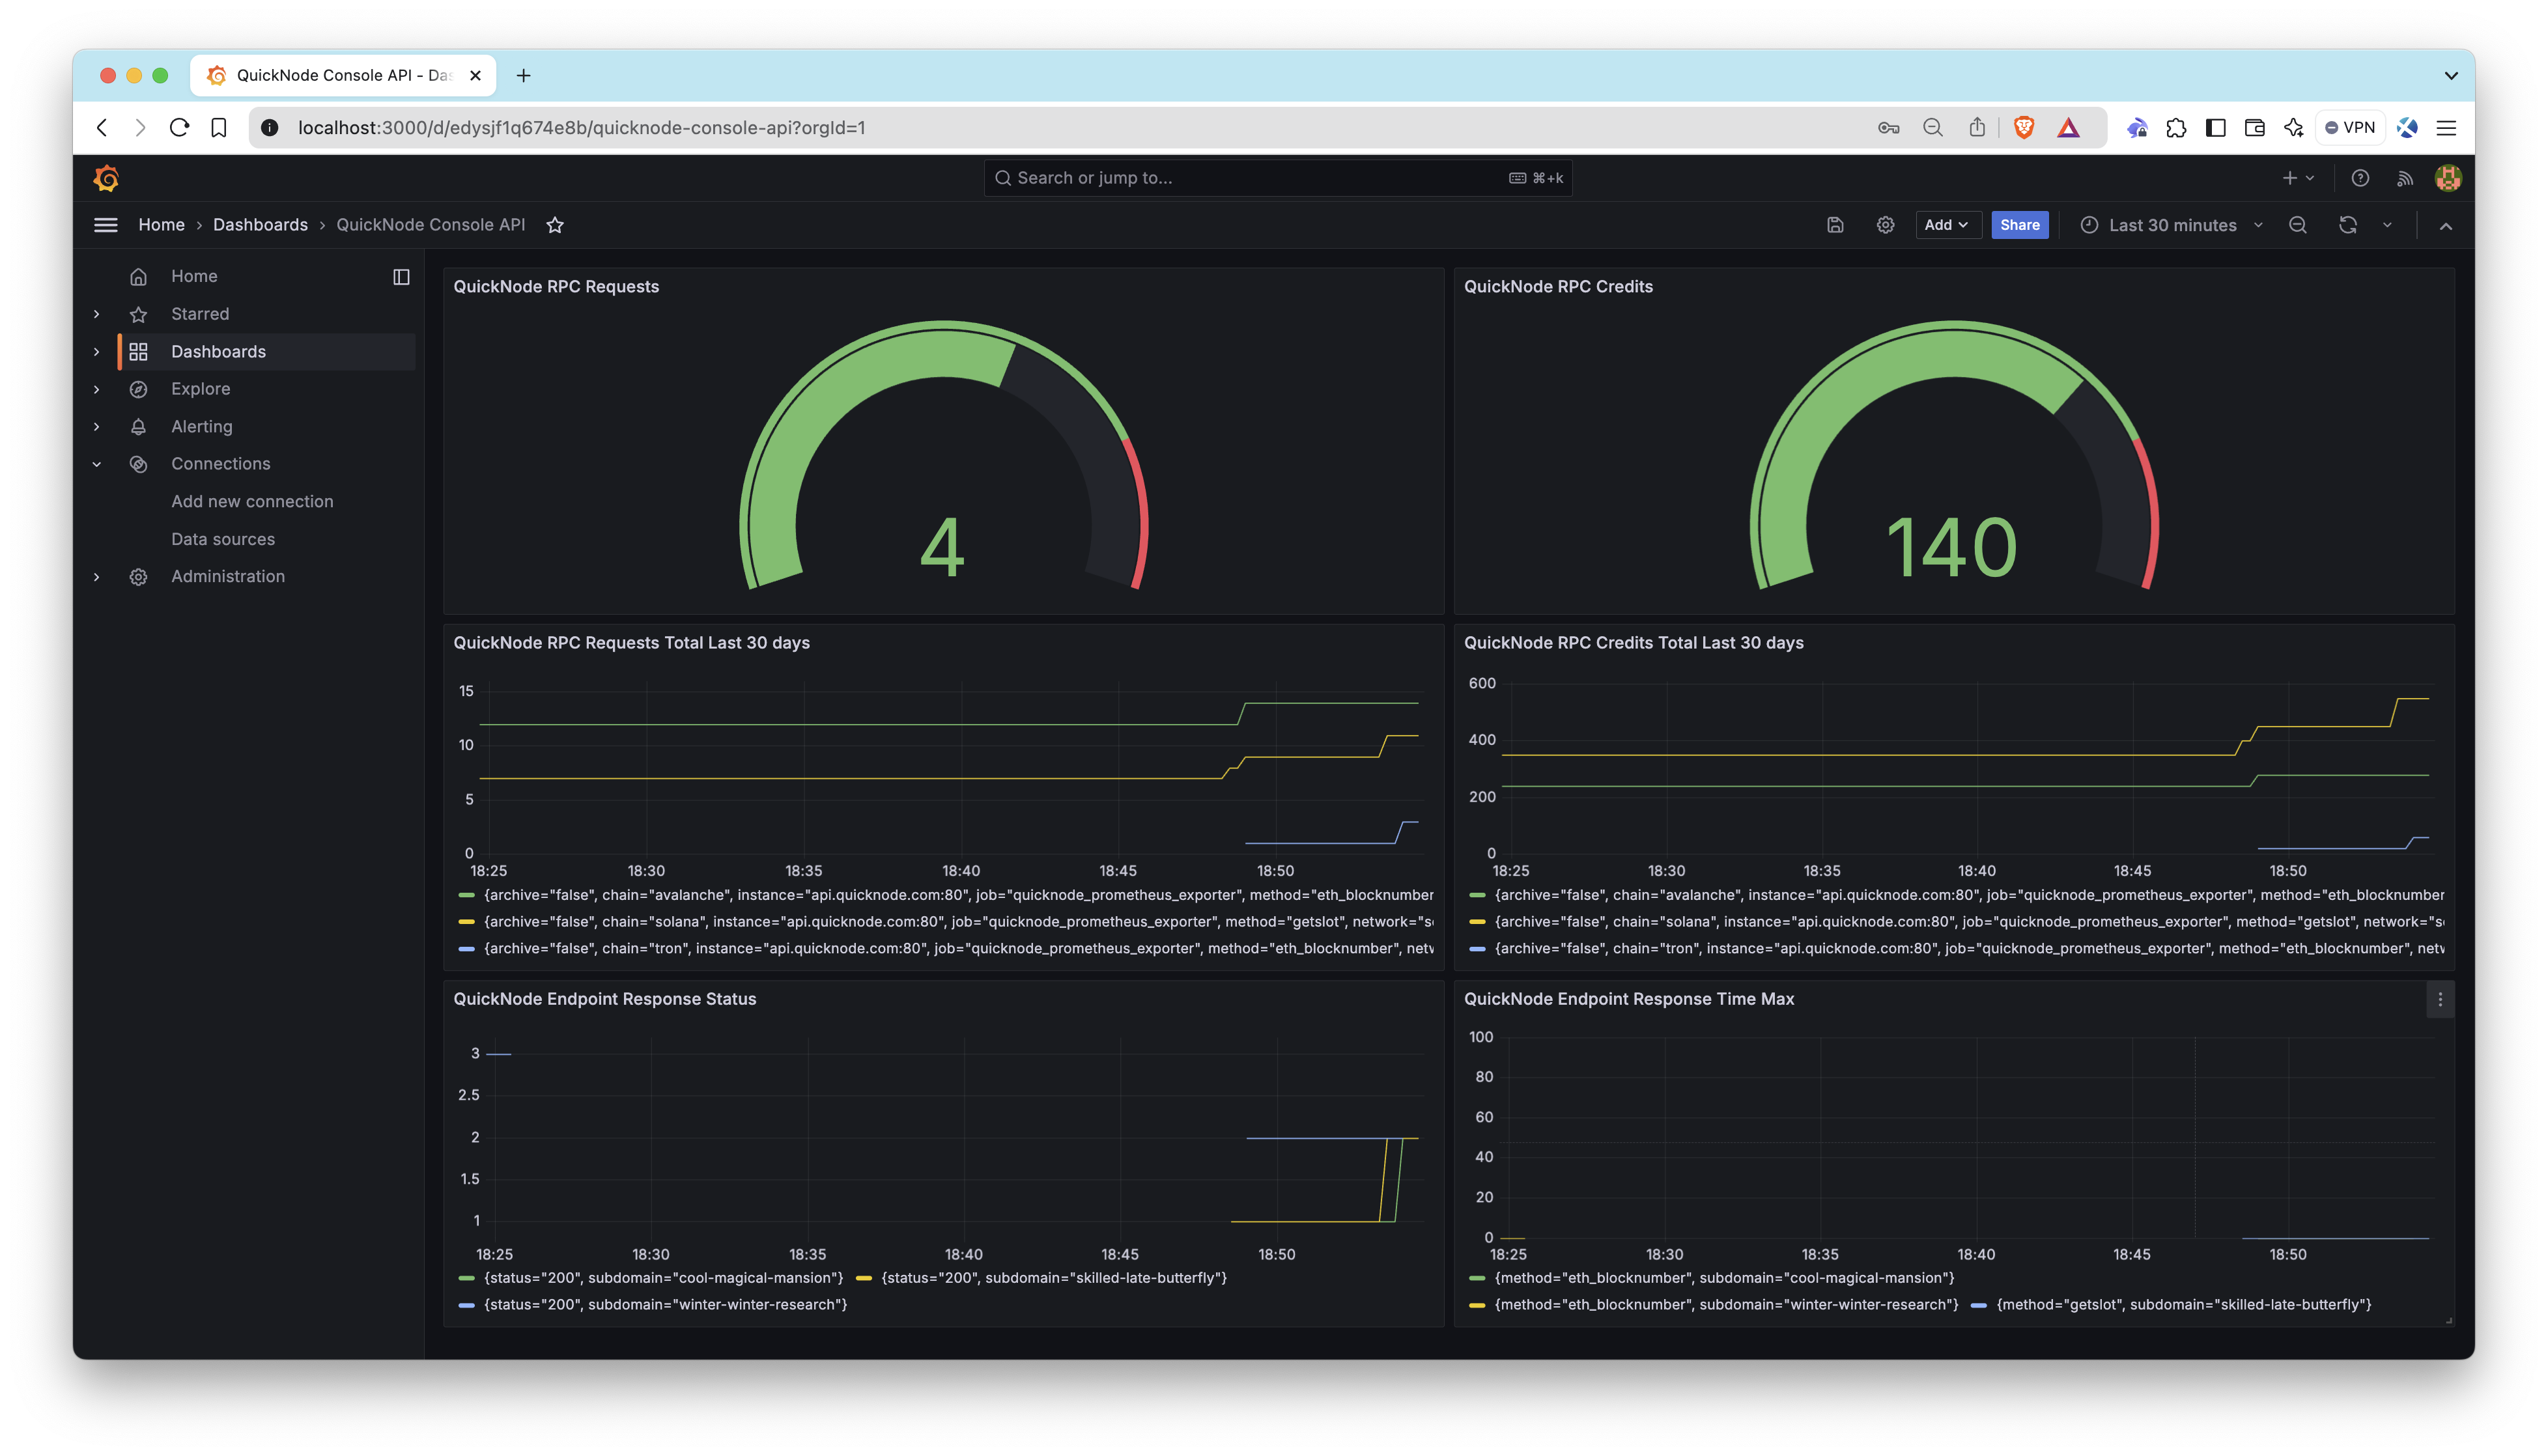
The dashboard provides the following panels to help you monitor your QuickNode infrastructure:
- QuickNode RPC Requests (Gauge): Displays the current total number of RPC requests made to your QuickNode endpoint.
- QuickNode RPC Credits (Gauge): Shows the total credits used by your QuickNode endpoint.
- QuickNode RPC Requests Total Last 30 days: A time series chart showing the total RPC requests over the last 30 days.
- QuickNode RPC Credits Total Last 30 days: A time series chart showing the total credit usage over the last 30 days.
- QuickNode Endpoint Response Status: Displays the response status (e.g., 200, 400, etc.) of your QuickNode endpoint requests.
- QuickNode Endpoint Response Time Max: Shows the maximum response time of your endpoint.
Feel free to customize the dashboard by editing panels, adding new ones, or adjusting the time range to suit your needs.
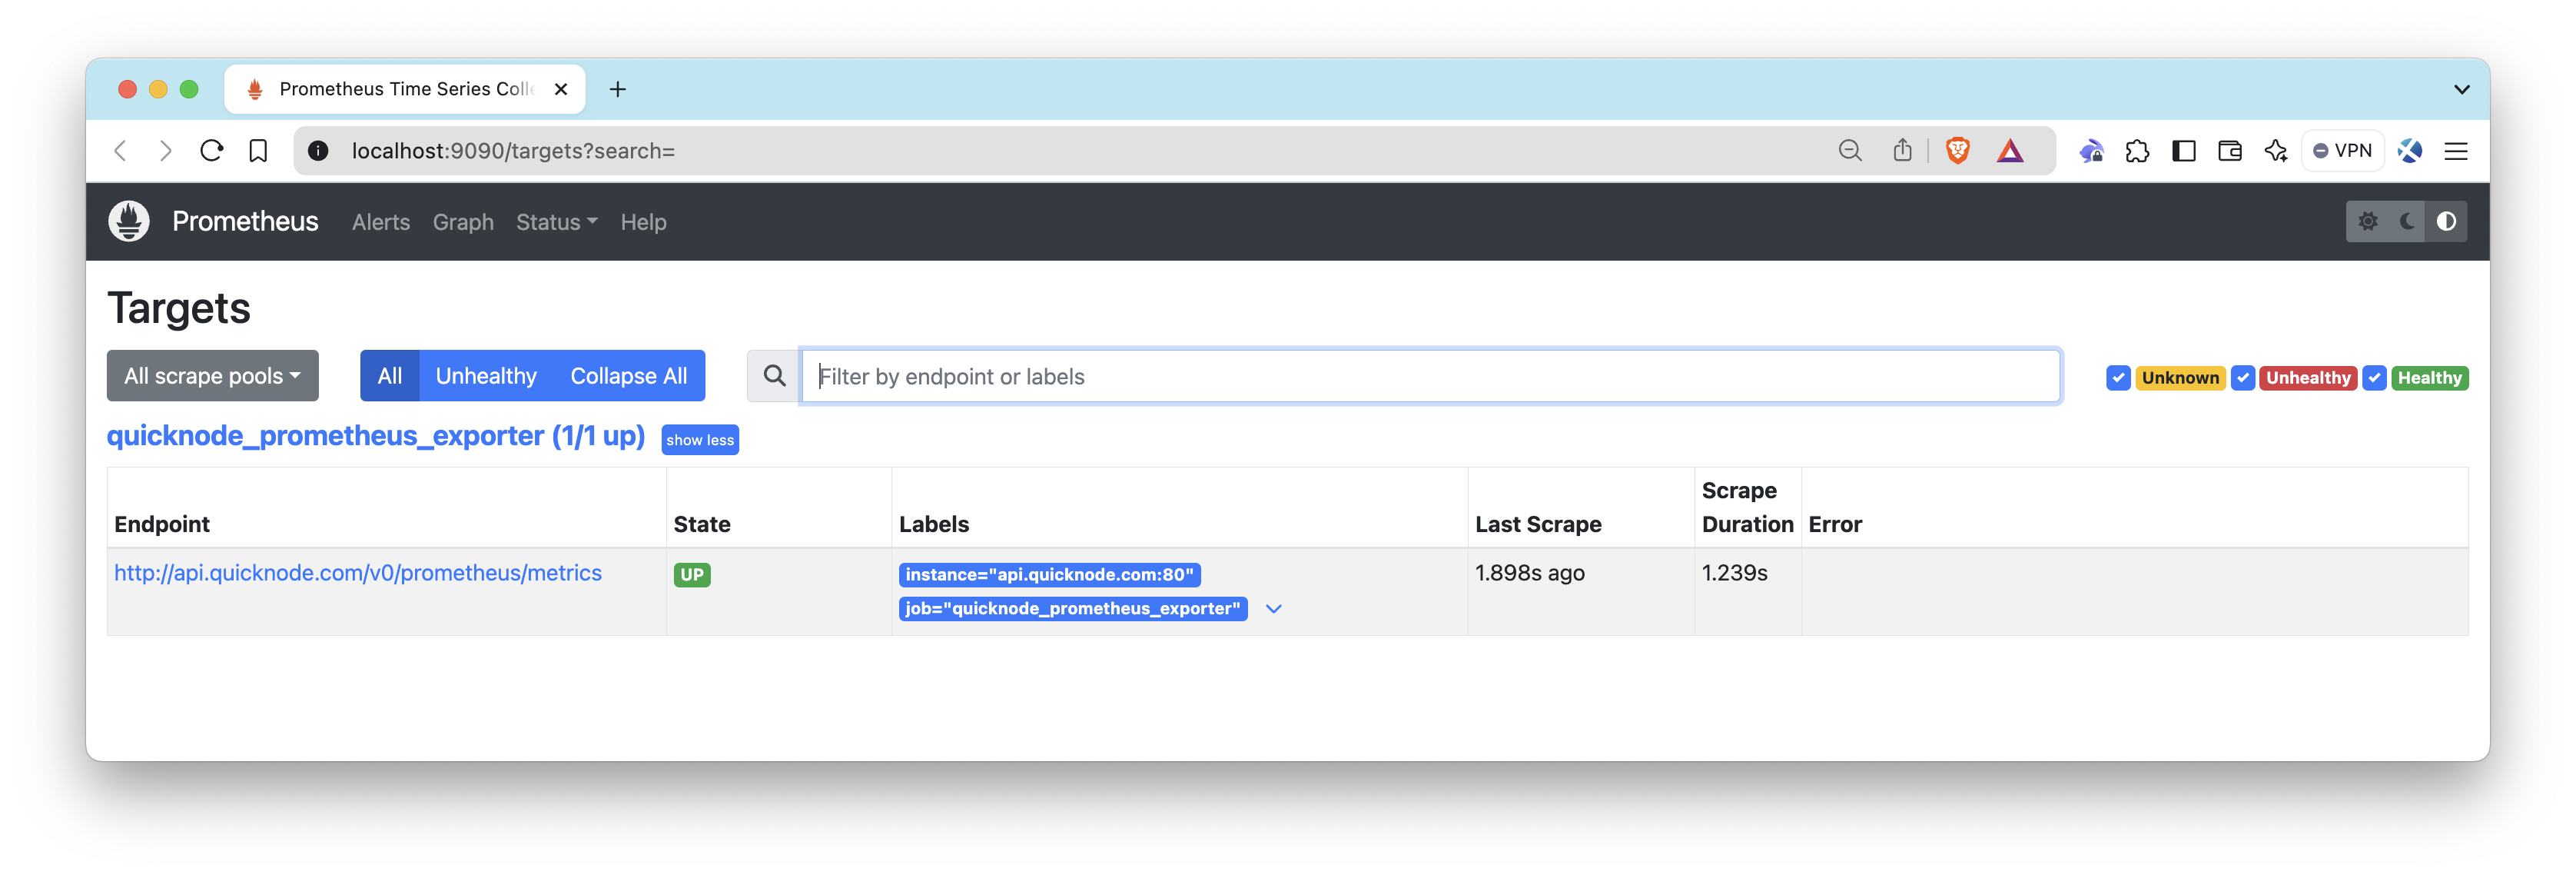
If you'd like to explore the metrics collected by Prometheus directly, you can follow these steps:
- Open a web browser and go to http://localhost:9090
- Navigate to Status > Targets in the Prometheus interface to confirm that the QuickNode target is listed and in the UP state.
- Check key metrics that QuickNode exposes:
- Navigate to Graph tab.
- In the expression box, enter one of these metrics one by one and click Execute:
quicknode_rpc_creditsquicknode_rpc_requestsquicknode_rpc_response_statusquicknode_rpc_response_time_max
- This will allow you to see the raw data being collected, either as a graph or in tabular form.
When you're done, you can stop the services by running:
docker-compose down
Conclusion
Congratulations! 🎉 You've successfully built a Grafana dashboard to monitor your QuickNode metrics using Prometheus. This setup gives you valuable real-time insights into your RPC infrastructure, enabling you to optimize performance and maintain visibility.
If you have questions, any ideas or suggestions, please contact us directly. Also, stay up to date with the latest by following us on Twitter and joining our Discord and Telegram announcement channel.
We ❤️ Feedback!
Let us know if you have any feedback or requests for new topics. We'd love to hear from you.